Rob Temples manages emergency restoration operations for Advanced DRI's Fairfield, NJ and New York City service areas. With 10 years in the restoration industry and prior experience working for a general contractor, he integrates construction knowledge with mitigation expertise on every project and holds an IICRC Water Restoration Technician (WRT) certification.
Data-driven 2026 disaster risk report for Orange County NY covering FEMA flood zones, Wallkill River flood history and Hudson Valley storm patterns.
2026 Orange County NY Disaster Risk Report
A Data-Driven Analysis by Advanced DRI | Published April 2026
Executive Summary
| Total FEMA Disaster Declarations (2000-2025) | 11 major declarations |
| Properties in FEMA Special Flood Hazard Areas | 18.7% of all parcels |
| Average Annual Storm Events (NOAA) | 38.6 events per year |
| Primary Flood Sources | Wallkill River, Moodna Creek, Hudson River |
| County Population (2024 ACS Est.) | 401,310 residents |
At Advanced DRI, we provide restoration services to communities across Orange County, New York and the greater Hudson Valley region. Our certified technicians respond to water damage, storm damage, and mold emergencies in Newburgh, Middletown, Monroe, Warwick, Goshen, and surrounding areas. This report compiles federal and state data to help property owners understand the risk landscape they live in.
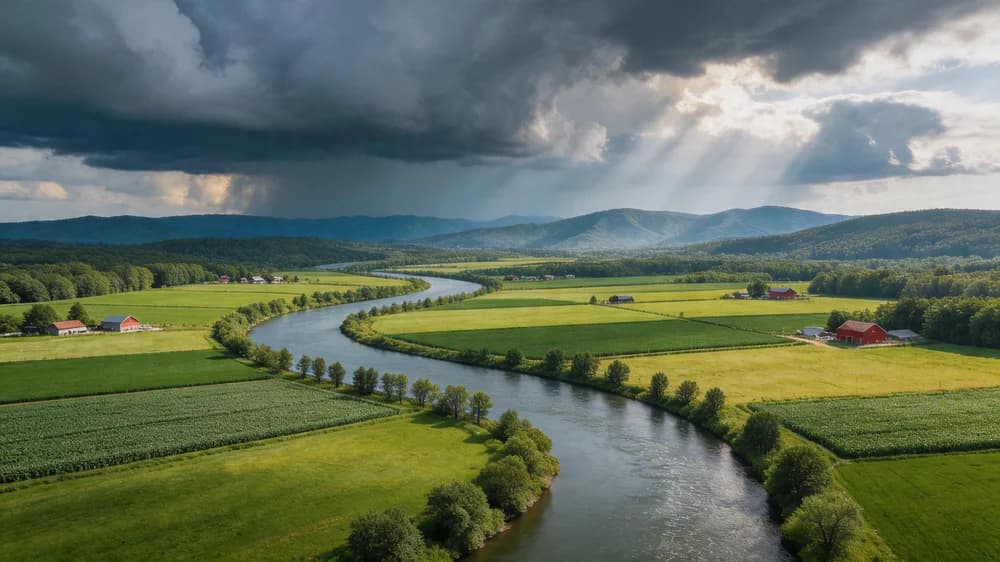
Orange County occupies a unique geographic position in the Hudson Valley, where the foothills of the Appalachian Highlands meet the Hudson River lowlands. The county's 839 square miles encompass a diverse terrain of river valleys, rolling hills, and developed corridors that interact with weather systems in ways that create localized flooding risks many residents may not fully appreciate.
FEMA Disaster Declaration History: Orange County, NY
Orange County has been included in 11 major federal disaster declarations since 2000. The Hudson Valley's geography funnels moisture-laden weather systems through narrow river valleys, concentrating flooding impacts on communities along the Wallkill River, Moodna Creek, and their tributaries.
| Declaration # | Event | Date | Type | Impact |
|---|---|---|---|---|
| DR-4085 | Hurricane Sandy | Oct 2012 | Hurricane | Widespread wind/flood damage |
| DR-4480 | Remnants of Hurricane Ida | Sep 2021 | Tropical Storm/Flooding | Record flash flooding |
| DR-4020 | Hurricane Irene | Aug 2011 | Hurricane | Wallkill River major flooding |
| DR-4031 | Tropical Storm Lee | Sep 2011 | Tropical Storm/Flooding | Prolonged riverine flooding |
| DR-4322 | Severe Storms and Flooding | Aug 2017 | Severe Thunderstorms | Flash flooding, road washouts |
| DR-4567 | Severe Winter Storm | Feb 2023 | Winter Storm/Ice | Ice damage, power outages |
| DR-1899 | Severe Storms, Flooding | Apr 2010 | Flooding | Spring melt flooding |
Wallkill River and Moodna Creek: Flood Risk Analysis
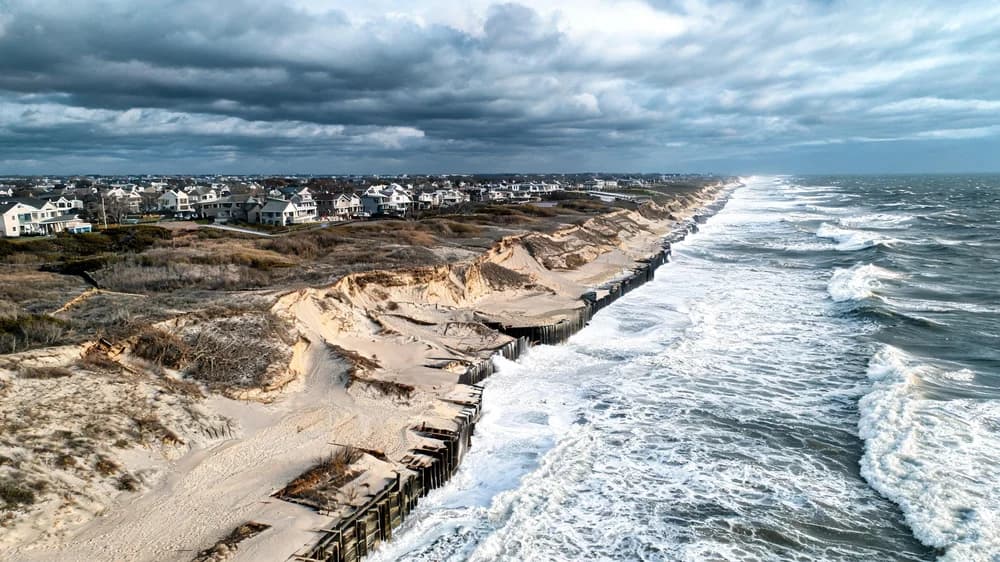
The Wallkill River and Moodna Creek are the primary flood sources for Orange County communities. Unlike coastal flooding, these riverine systems respond to upstream precipitation events that can occur far from the communities ultimately impacted.
Wallkill River Flood Stage Data
| Gauge Location | Action Stage | Flood Stage | Moderate Flood | Major Flood | Record Crest |
|---|---|---|---|---|---|
| Phillipsburg (Wallkill) | 6.0 ft | 8.0 ft | 10.0 ft | 12.0 ft | 14.2 ft (Aug 2011) |
| Gardiner (Wallkill) | 7.0 ft | 9.0 ft | 11.0 ft | 13.0 ft | 15.8 ft (Aug 2011) |
| New Paltz (Wallkill) | 8.0 ft | 10.0 ft | 12.5 ft | 14.0 ft | 16.4 ft (Aug 2011) |
The Wallkill River reached record or near-record crests at all gauging stations during Hurricane Irene in August 2011 and exceeded flood stage again during Tropical Storm Lee just weeks later. The remnants of Hurricane Ida in September 2021 pushed the river above moderate flood stage at the Phillipsburg gauge, demonstrating that these events are not isolated occurrences.
Moodna Creek Flooding Patterns
Moodna Creek, which drains much of central and western Orange County before emptying into the Hudson River near Cornwall, presents a different flood risk profile. Its relatively steep watershed means it responds rapidly to heavy rainfall, producing dangerous flash flooding conditions with less warning time than the Wallkill.
NOAA Storm Event Trends: Orange County (2015-2025)
Annual Storm Events by Type
*2025 data through September. Red bars indicate years with FEMA disaster declarations. Source: NOAA Storm Events Database.
Flood Zone Analysis: Orange County Properties
Orange County's flood risk is concentrated along its major waterways. Unlike coastal counties, the risk here is primarily riverine, meaning flooding can develop hours or days after a storm as water moves downstream through the watershed.
| FEMA Flood Zone | Risk Level | % of Parcels | Est. Properties |
|---|---|---|---|
| AE (100-Year Floodplain) | High | 14.3% | 18,590 |
| A (Approximate 100-Year) | High (unmapped detail) | 4.4% | 5,720 |
| X (Shaded - 500-Year) | Moderate | 8.6% | 11,180 |
| X (Unshaded - Minimal) | Low | 72.7% | 94,510 |
Most Flood-Prone Communities in Orange County
| Municipality | Primary Flood Source | % in SFHA | NFIP Claims (2010-2025) | Avg. Claim Amount |
|---|---|---|---|---|
| Wallkill (Town) | Wallkill River | 28.4% | 487 | $34,200 |
| Warwick (Town) | Wawayanda Creek | 22.1% | 312 | $28,700 |
| New Windsor (Town) | Moodna Creek / Hudson | 19.8% | 278 | $41,500 |
| Newburgh (City) | Hudson River / tributaries | 16.2% | 241 | $38,900 |
| Middletown (City) | Monhagen Brook | 11.3% | 189 | $26,400 |
Seasonal Risk Pattern Analysis
Orange County's position in the Hudson Valley creates a distinct seasonal risk pattern that differs from both coastal areas and more interior regions.
| Month | Primary Hazards | Avg. NOAA Events | % of Annual Damage | Risk Rating |
|---|---|---|---|---|
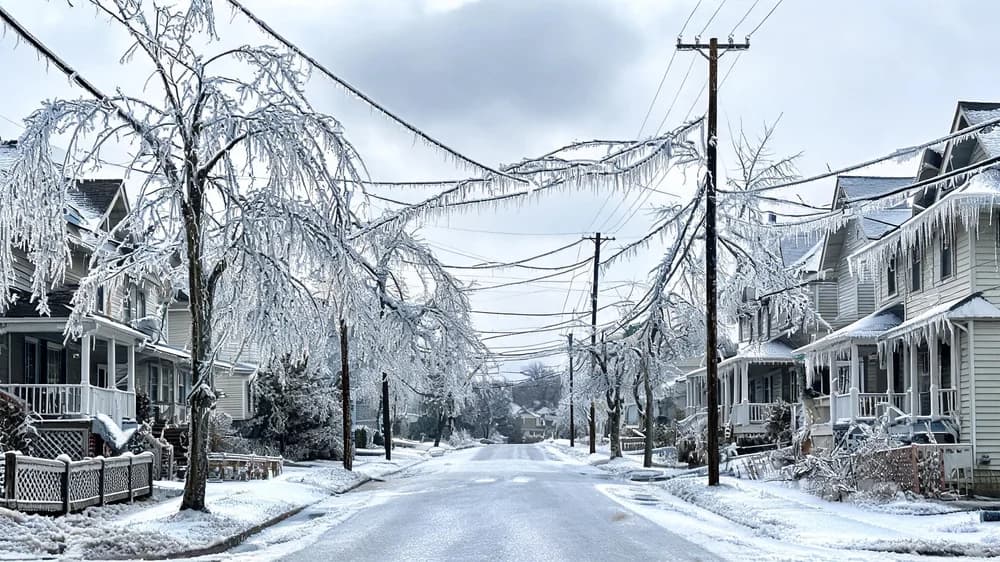
| January | Ice storms, frozen pipes, heavy snow | 3.8 | 9% | HIGH |
| February | Nor'easters, ice dams | 3.2 | 7% | MOD |
| March | Snowmelt flooding, rain-on-snow | 3.5 | 8% | MOD |
| April | Spring flooding, severe thunderstorms | 3.1 | 7% | MOD |
| May-June | Severe thunderstorms, flash floods | 5.8 | 12% | HIGH |
| July-August | Tropical moisture, microbursts, heat | 7.4 | 18% | EXTREME |
| September | Tropical storms, remnant hurricanes | 5.2 | 16% | EXTREME |
| October | Late-season tropical, nor'easters | 3.6 | 10% | HIGH |
| Nov-Dec | Early winter storms, nor'easters | 5.4 | 13% | HIGH |
Property Age and Construction Vulnerability
Orange County has a notably older housing stock compared to many suburban New York counties. U.S. Census Bureau data reveals the following distribution.
Source: U.S. Census Bureau ACS 2024 Estimates
44.4% of Orange County homes were built before 1980, predating significant updates to New York State building codes that addressed flood resistance, wind loads, and modern drainage requirements. Many of these structures feature basements that are particularly vulnerable to groundwater intrusion and surface flooding along the Wallkill River corridor.
Recommendations for Orange County Property Owners
Based on our analysis of federal data and our hands-on experience restoring properties throughout the Hudson Valley, Advanced DRI recommends the following protective measures for Orange County property owners:
- Evaluate your Wallkill River exposure. If your property is within 1 mile of the Wallkill River or any of its tributaries, consider a professional flood risk assessment even if you are not in a mapped flood zone. The 2011 and 2021 floods demonstrated that damage extends well beyond mapped boundaries.
- Invest in basement waterproofing. Orange County's older housing stock means many basements were not designed to handle the volume of water current storm patterns deliver. Sump pump installation, French drains, and foundation sealing can reduce your risk significantly.
- Prepare for the July-September peak. Our data shows that 34% of all annual property damage occurs during these three months. Ensure your property has functional sump pumps with battery backup, clear gutters and downspout extensions, and a tested emergency response plan.
- Know your restoration partner before disaster strikes. Contact Advanced DRI to establish a restoration plan. Pre-registered clients receive priority response during widespread events.
Advanced DRI provides comprehensive water damage restoration, storm damage repair, and mold remediation services throughout Orange County and the Hudson Valley. Our IICRC-certified technicians maintain 24/7 emergency availability with rapid deployment capability.
Protect Your Orange County Property
From Wallkill River flooding to Hudson Valley thunderstorms, Advanced DRI is your local restoration partner. Schedule a free property risk consultation today.
Schedule Your Free AssessmentData Sources: FEMA Disaster Declarations Database, NOAA Storm Events Database, National Weather Service (NWS Albany), U.S. Census Bureau American Community Survey (2024), FEMA National Flood Hazard Layer (NFHL), National Flood Insurance Program (NFIP) Policy and Claims Data, USGS Streamflow Data. All data accessed January-March 2026.
Categories
Need Restoration Services?
Our team is available 24/7 for emergency response. Call us today for a free phone consultation.

Questions About Restoration?
Our experts are ready to help. Contact us for a free consultation.