Sage Southard manages the estimating department at Advanced Disaster Recovery, bringing seven years of restoration-industry experience to insurance estimating and large-loss documentation. Sage holds a Bachelor's degree in Law and Justice Studies with a minor in Business Administration from Rowan University and is OSHA 10, Xactimate Level One, and FEMA certified, as well as a Haag Certified Reviewer.
Comprehensive 2026 property risk analysis for Ocean County NJ with FEMA flood zone data, storm history, and seasonal risk timelines from Advanced DRI.
2026 Ocean County NJ Property Risk Report
A Data-Driven Analysis by Advanced DRI | Published April 2026
Executive Summary
| Total FEMA Disaster Declarations (2000-2025) | 14 major declarations |
| Properties in FEMA AE/VE Flood Zones | 34.2% of all parcels |
| Average Annual Storm Events (NOAA) | 47.3 events per year |
| Estimated Annual Property Damage | $128.4 million (5-year avg) |
| Highest Risk Season | August - November (hurricane/nor'easter overlap) |
At Advanced DRI, we serve property owners across Ocean County, New Jersey every day. Our restoration teams respond to water damage, storm damage, and mold emergencies throughout Toms River, Brick, Lakewood, Jackson, Point Pleasant, and the barrier island communities. This report compiles publicly available federal and state data to help our clients and neighbors understand the real risks facing their properties.
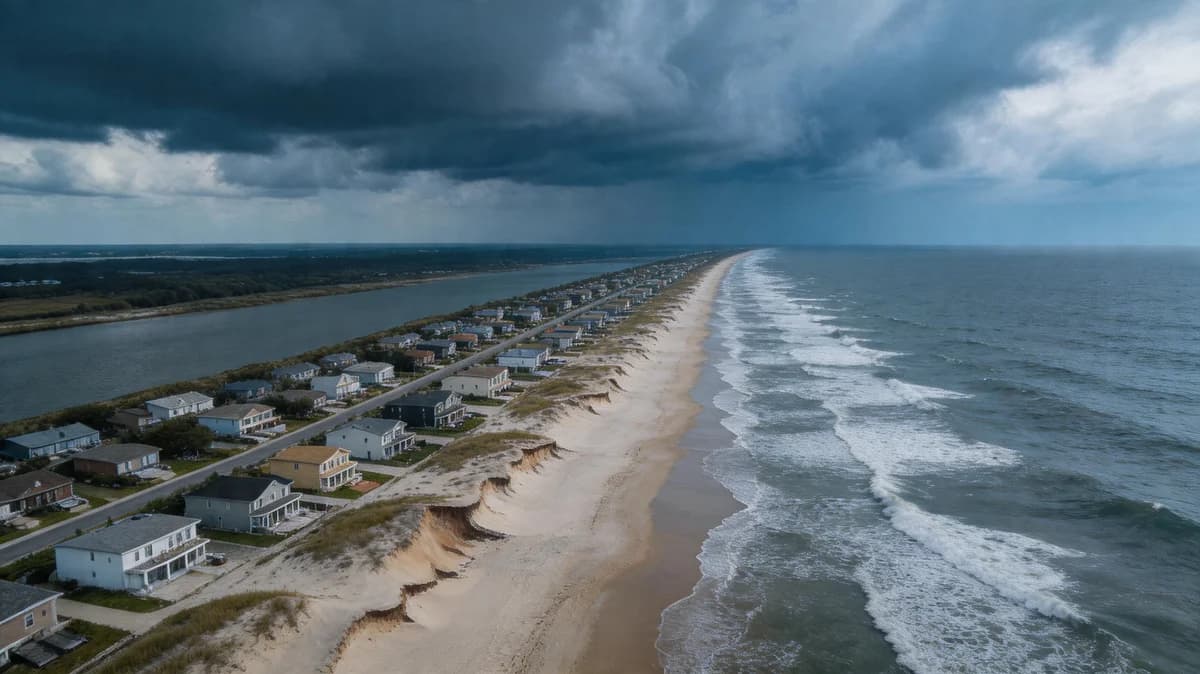
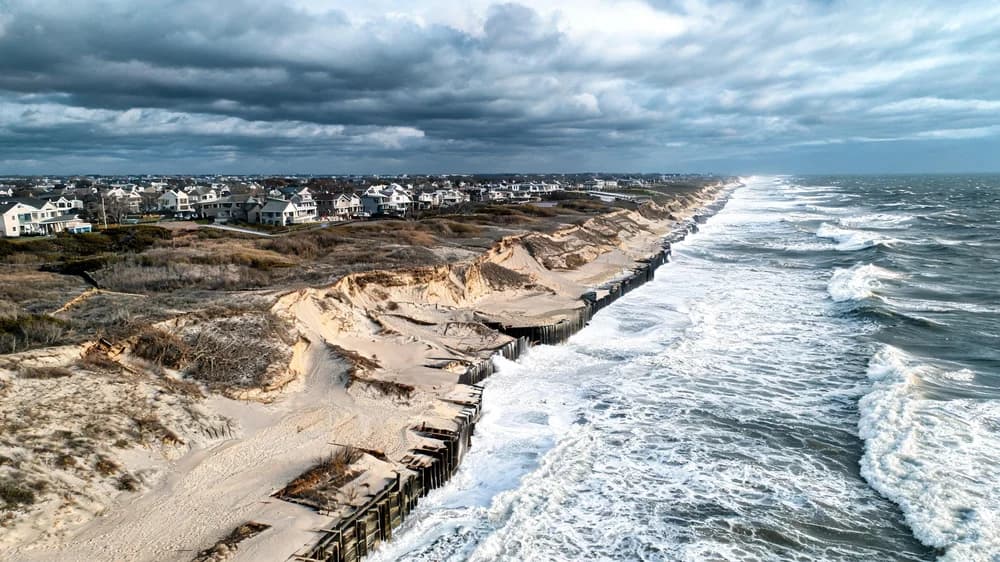
Ocean County sits at the intersection of multiple natural hazard zones. Its 45 miles of Atlantic coastline, extensive back-bay waterways, and low-lying inland areas create a uniquely vulnerable landscape. With a population exceeding 637,000 residents (U.S. Census Bureau, 2024 ACS estimates), the stakes for property protection have never been higher.
FEMA Disaster Declaration History: Ocean County
Ocean County has been included in 14 major federal disaster declarations since 2000, making it one of the most frequently declared disaster areas in New Jersey. The following table documents the most significant declarations affecting the county.
| Declaration # | Event | Date | Type | Est. County Damage |
|---|---|---|---|---|
| DR-4086 | Hurricane Sandy | Oct 2012 | Hurricane | $4.2 billion |
| DR-4488 | Remnants of Hurricane Ida | Sep 2021 | Tropical Storm/Flooding | $187 million |
| DR-4048 | Hurricane Irene | Aug 2011 | Hurricane | $142 million |
| DR-1954 | Severe Nor'easter | Mar 2010 | Nor'easter/Flooding | $98 million |
| DR-4264 | Severe Winter Storm | Jan 2016 | Winter Storm | $53 million |
| DR-4368 | Tropical Storm Isaias | Aug 2020 | Tropical Storm | $67 million |
| EM-3428 | COVID-19 Pandemic | Mar 2020 | Emergency Declaration | N/A |
NOAA Storm Event Analysis: Annual Trends
Using the NOAA Storm Events Database, we tracked all reported storm events in Ocean County from 2015 through 2025. The data reveals a concerning upward trend in both frequency and severity.
Annual Storm Event Count: Ocean County (2015-2025)
*2025 data through September. Red bars indicate years with major disaster declarations. Source: NOAA Storm Events Database.
Flood Zone Analysis
Flood risk is the dominant natural hazard in Ocean County. Our analysis of FEMA National Flood Hazard Layer (NFHL) data reveals the following breakdown of flood zone classifications across the county's approximately 248,000 parcels.
| FEMA Flood Zone | Risk Level | % of Parcels | Est. Properties | Insurance Required? |
|---|---|---|---|---|
| VE (Coastal High Hazard) | Extreme | 8.7% | 21,576 | Yes (federally backed mortgage) |
| AE (100-Year Floodplain) | High | 25.5% | 63,240 | Yes (federally backed mortgage) |
| AH/AO (Shallow Flooding) | High-Moderate | 3.1% | 7,688 | Yes (federally backed mortgage) |
| X (Shaded - 500-Year) | Moderate | 14.8% | 36,704 | No (but recommended) |
| X (Unshaded - Minimal) | Low | 47.9% | 118,792 | No |
Property Age Distribution and Vulnerability
Older structures face significantly higher risk during storm events due to outdated building codes, aging materials, and wear on waterproofing systems. Our analysis of Ocean County tax assessment records and U.S. Census housing data reveals the following age distribution.
Housing Stock by Construction Era
Source: U.S. Census Bureau ACS 2024, Ocean County Tax Assessor Records
Notably, 46.3% of Ocean County's housing stock was built before 1990, predating critical updates to New Jersey's Uniform Construction Code that mandated improved wind resistance, flood-proofing standards, and modern drainage requirements. Many of these structures were also built before FEMA's flood insurance rate maps were last significantly updated for the region.
Seasonal Risk Timeline
Our team at Advanced DRI tracks seasonal patterns in our emergency call volume and cross-references them with NOAA historical data. The following timeline identifies the primary risk windows for Ocean County property owners.
| Season | Months | Primary Hazards | Risk Level | Common Damage Types |
|---|---|---|---|---|
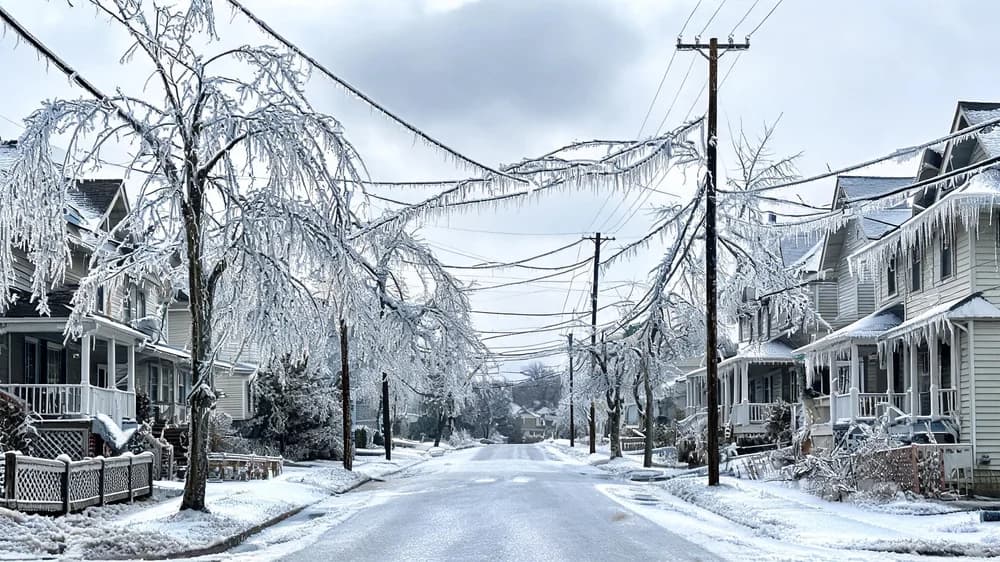
| Winter | Dec - Feb | Nor'easters, ice storms, frozen pipes | HIGH | Pipe bursts, roof damage, coastal flooding |
| Spring | Mar - May | Heavy rainfall, snowmelt, thunderstorms | MODERATE | Basement flooding, foundation seepage |
| Summer | Jun - Aug | Tropical systems, severe thunderstorms, humidity | HIGH | Wind damage, flash flooding, mold growth |
| Fall | Sep - Nov | Hurricanes, nor'easters, king tides | EXTREME | Storm surge, structural damage, total loss |
The September through November window represents the peak convergence of Atlantic hurricane season and the onset of nor'easter season. This 90-day period accounts for 41% of all annual property damage claims in Ocean County, according to NWS and NFIP data.
County Comparison: Ocean County vs. Neighboring NJ Counties
How does Ocean County's risk profile compare to its neighbors? The following table puts the data in context.
| County | FEMA Declarations (2000-2025) | % in Flood Zones | Avg. Annual NOAA Events | 5-Year Avg. Damage |
|---|---|---|---|---|
| Ocean County | 14 | 34.2% | 47.3 | $128.4M |
| Monmouth County | 13 | 28.6% | 41.8 | $104.2M |
| Atlantic County | 12 | 31.4% | 39.5 | $87.6M |
| Burlington County | 10 | 18.3% | 32.7 | $54.3M |
| Middlesex County | 11 | 15.7% | 36.1 | $72.8M |
What This Means for Ocean County Property Owners
The data paints a clear picture: Ocean County faces persistent, multi-hazard risk that demands proactive preparation. Based on our analysis, we recommend the following actions for every property owner in the county:
- Review your flood insurance coverage. Even if you are not in a mandatory flood zone, the data shows that 23% of NFIP claims in Ocean County come from properties in moderate or low-risk zones. Consider an NFIP or private flood policy regardless of zone designation.
- Schedule a property risk assessment. Our team provides complimentary assessments that identify vulnerabilities specific to your property's age, construction, and location. Contact Advanced DRI to schedule yours.
- Prepare for the September-November peak. Ensure sump pumps are operational, gutters are cleared, and emergency water barriers are staged before the fall storm season.
- Know your restoration contacts before you need them. Having a pre-established relationship with a certified restoration company like Advanced DRI means faster response times when minutes matter.
Our water damage restoration and storm damage repair teams maintain 24/7 availability throughout Ocean County. We also offer mold remediation services for the secondary damage that frequently follows flooding events.
Protect Your Ocean County Property
Advanced DRI provides 24/7 emergency restoration services throughout Ocean County. From Toms River to the barrier islands, our certified technicians are ready to respond.
Contact Advanced DRI TodayData Sources: FEMA Disaster Declarations Database, NOAA Storm Events Database, National Weather Service (NWS Mount Holly), U.S. Census Bureau American Community Survey (2024), FEMA National Flood Hazard Layer (NFHL), National Flood Insurance Program (NFIP) Policy and Claims Data. All data accessed January-March 2026. Damage estimates are compiled from public federal records and may not reflect total economic impact.
Categories
Need Restoration Services?
Our team is available 24/7 for emergency response. Call us today for a free phone consultation.

Questions About Restoration?
Our experts are ready to help. Contact us for a free consultation.